Quick Start
Welcome to Dgraph! This guide will get you up and running in minutes. You'll learn how to start Dgraph, load sample data, and run your first queries.
Prerequisites
- Docker installed and running
- A terminal window
- About 5 minutes
Step 1: Start Dgraph
Run Dgraph using the official Docker image:
docker run --detach --name dgraph-play \
  -v $(pwd):/dgraph \
  -p "8080:8080" \
  -p "9080:9080" \
  dgraph/standalone:v24.1.4
This command:
- Starts Dgraph in the background (
--detach) - Names the container
dgraph-playfor easy management - Mounts your current directory to
/dgraphin the container - Exposes ports 8080 (HTTP) and 9080 (gRPC)
Verify it's running:
curl http://localhost:8080/health | jq
You should see a healthy status response. If you don't have jq installed, you can remove it from the command.
Step 2: Load Sample Data
Download the sample dataset (movie data):
wget https://github.com/dgraph-io/dgraph-benchmarks/raw/refs/heads/main/data/1million.rdf.gz
wget https://raw.githubusercontent.com/dgraph-io/dgraph-benchmarks/refs/heads/main/data/21million.schema
Load the data into Dgraph:
docker exec -it dgraph-play dgraph live \
  -f 1million.rdf.gz \
  -s 21million.schema
This loads over 1 million movie-related facts into your database. The process takes about 15-30 seconds.
Step 3: Open Ratel UI
Ratel is Dgraph's visual query interface. Start it with:
docker run --rm -it -p 8000:8000 dgraph/ratel:latest
Then:
- Open
http://localhost:8000in your browser - Enter
http://localhost:8080as the Dgraph connection string - Click Connect
You're now connected! Click Continue to access the console.
Step 4: Run Your First Query
In Ratel's Query tab, paste this DQL query:
{
  film(func: has(genre), first: 3) {
    name@*
    genre {
      name: name@.
    }
    starring {
      performance.actor {
        name: name@.
      }
      performance.character {
        name: name@.
      }
    }
  }
}
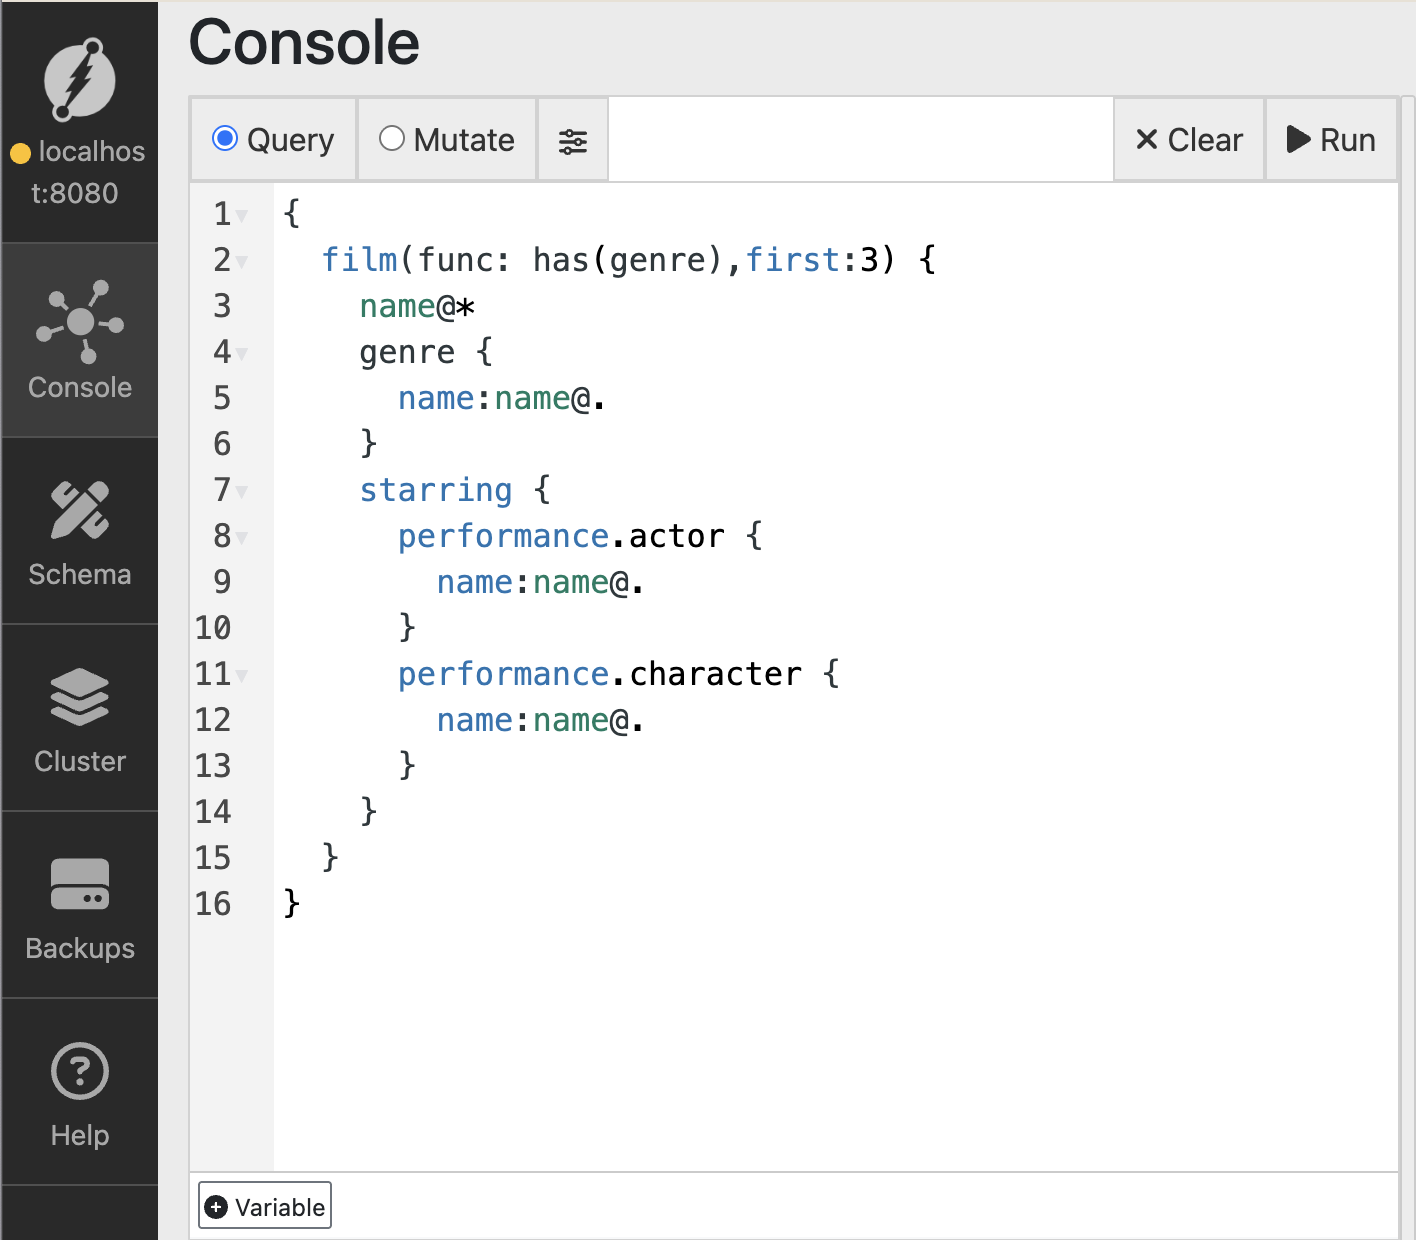
Click Run to execute the query. This finds movies with genres and displays their details, including actors and characters.
What this query does:
- Finds nodes that have a
genrepredicate - Returns the first 3 results
- Retrieves movie names, genres, and starring information
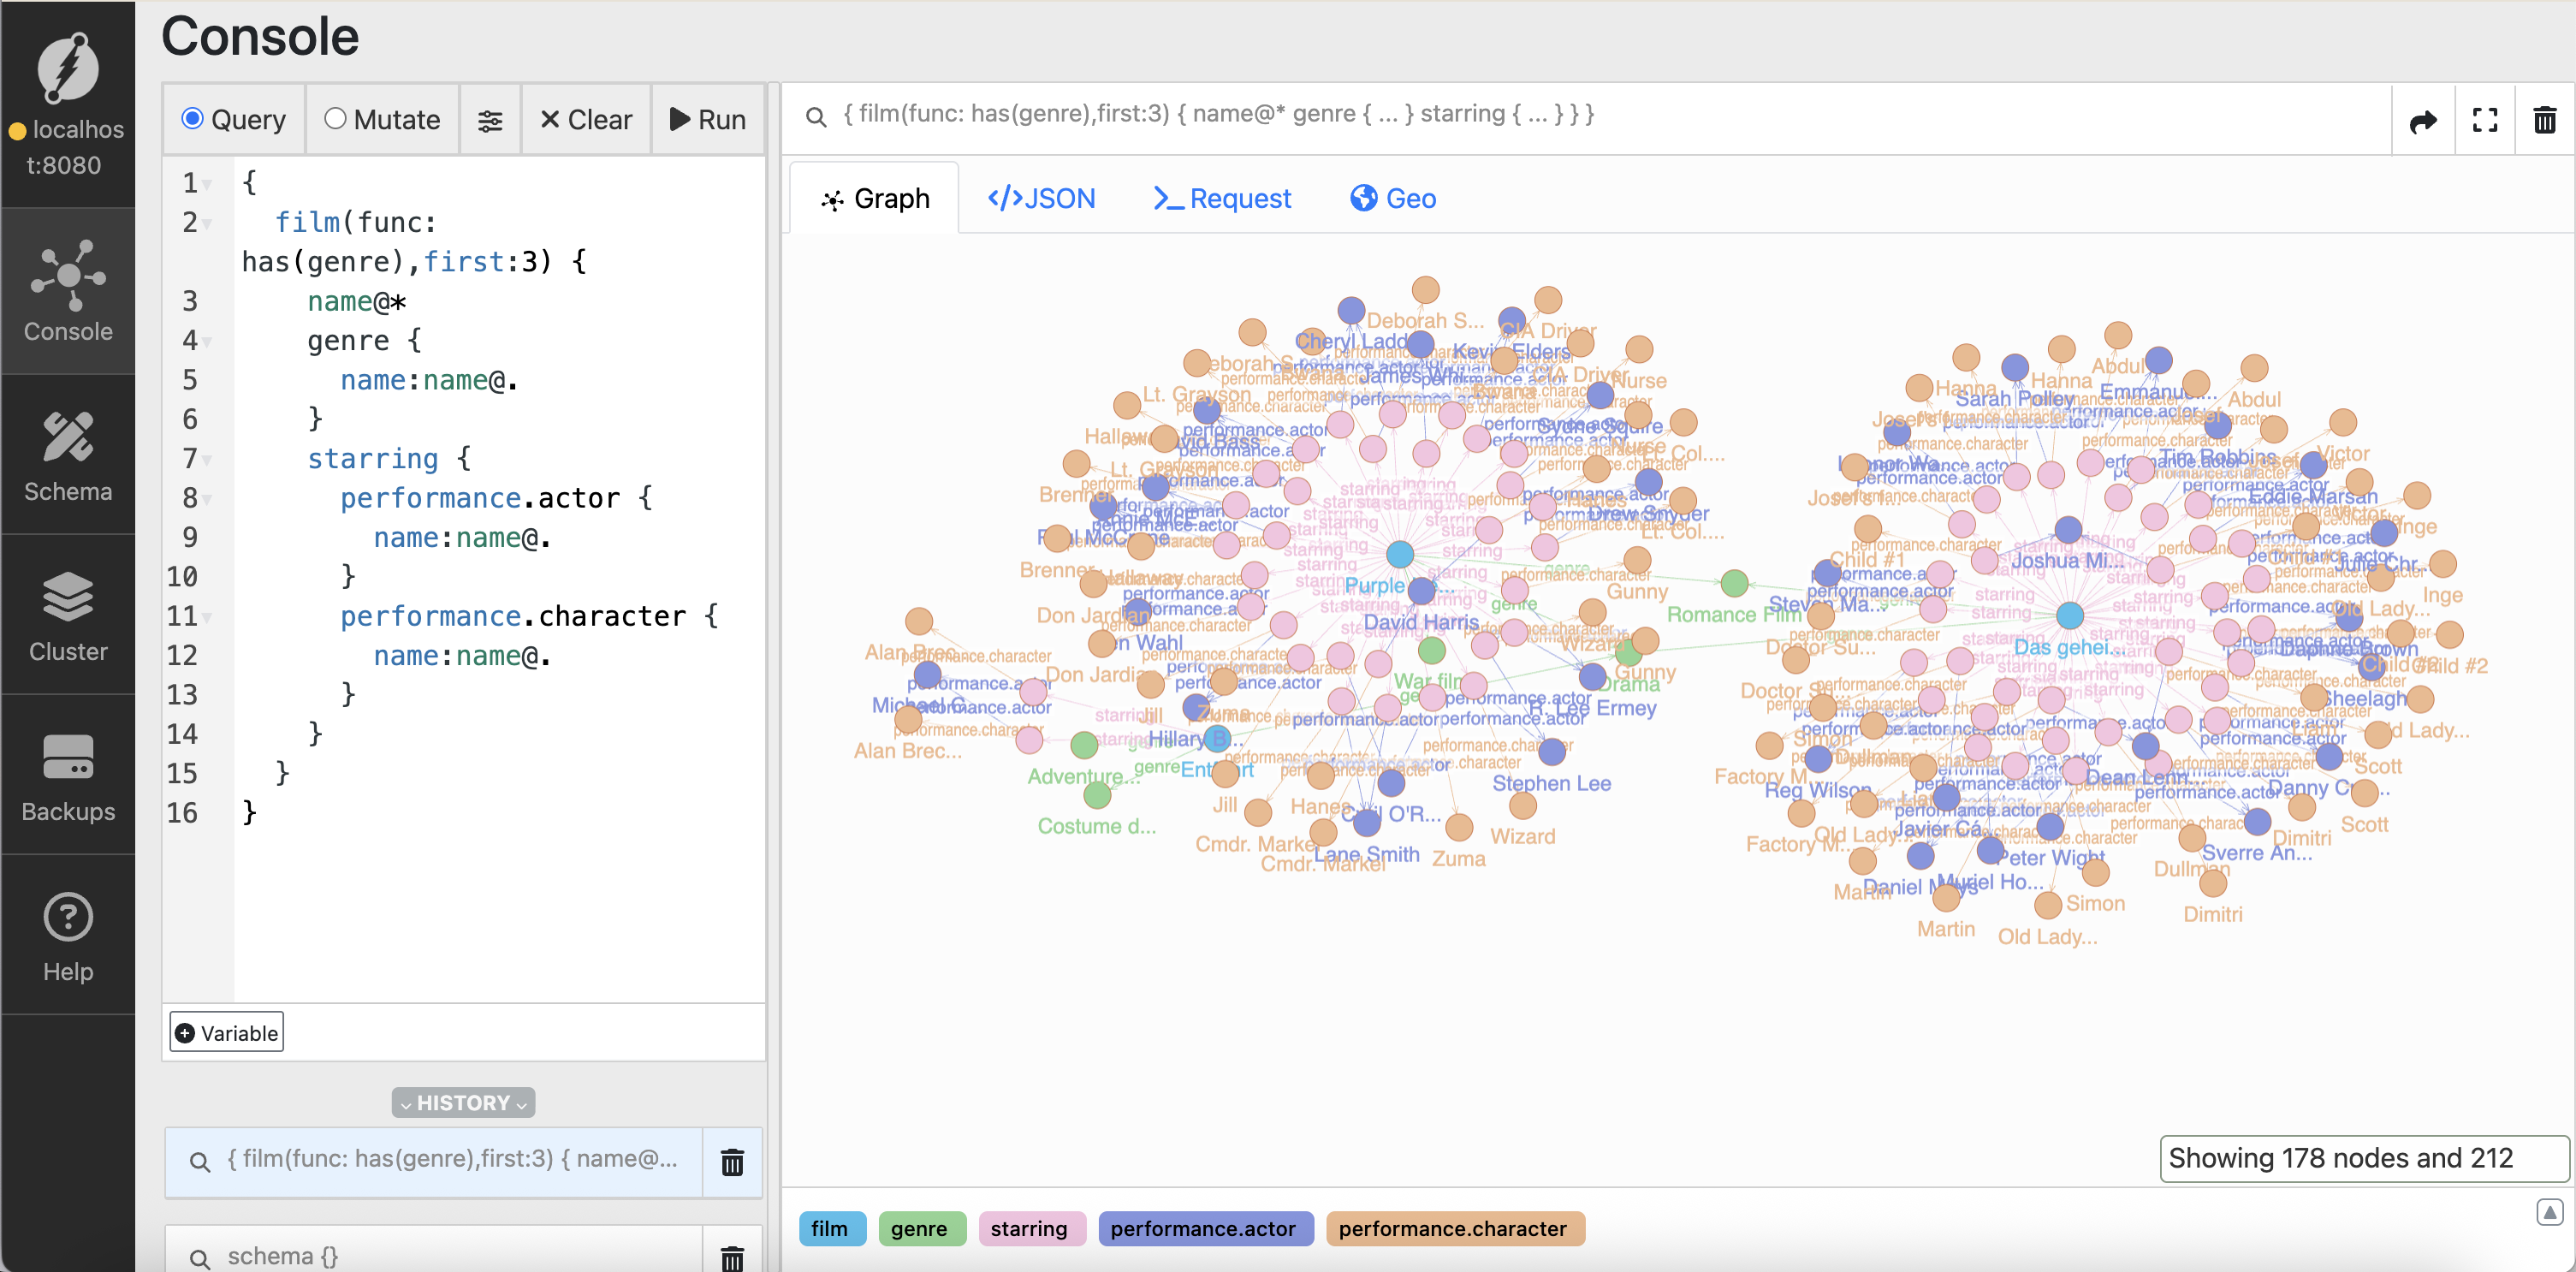
Step 5: Explore the Results
View your results in two ways:
- JSON tab - See the raw data structure
- Graph tab - Visualize the relationships
Switch to the Graph tab to see how movies, genres, actors, and characters are connected.
What's Next?
Congratulations! You've successfully:
- ✅ Started a Dgraph instance
- ✅ Loaded real-world data
- ✅ Run your first graph query
- ✅ Explored results visually
Continue learning:
- DQL Query Guide - Master Dgraph's query language
- Clients - Connect from your application
- Installation Guide - Production deployment options